Dashboard calculations
Use this article to better understand how different calculations take place throughout both the Learner and Cohort profile dashboards.
Click the below links to learn more about each of the following calculations:
- Overall attendance percentage
- Achievement semester rollup
- Assessment weightings
- Cohort average
- 'Like student'
- ZPD (Zone of Proximal Development)
- Growth rates
- Cohort relative growth
➡️ Overall attendance percentage
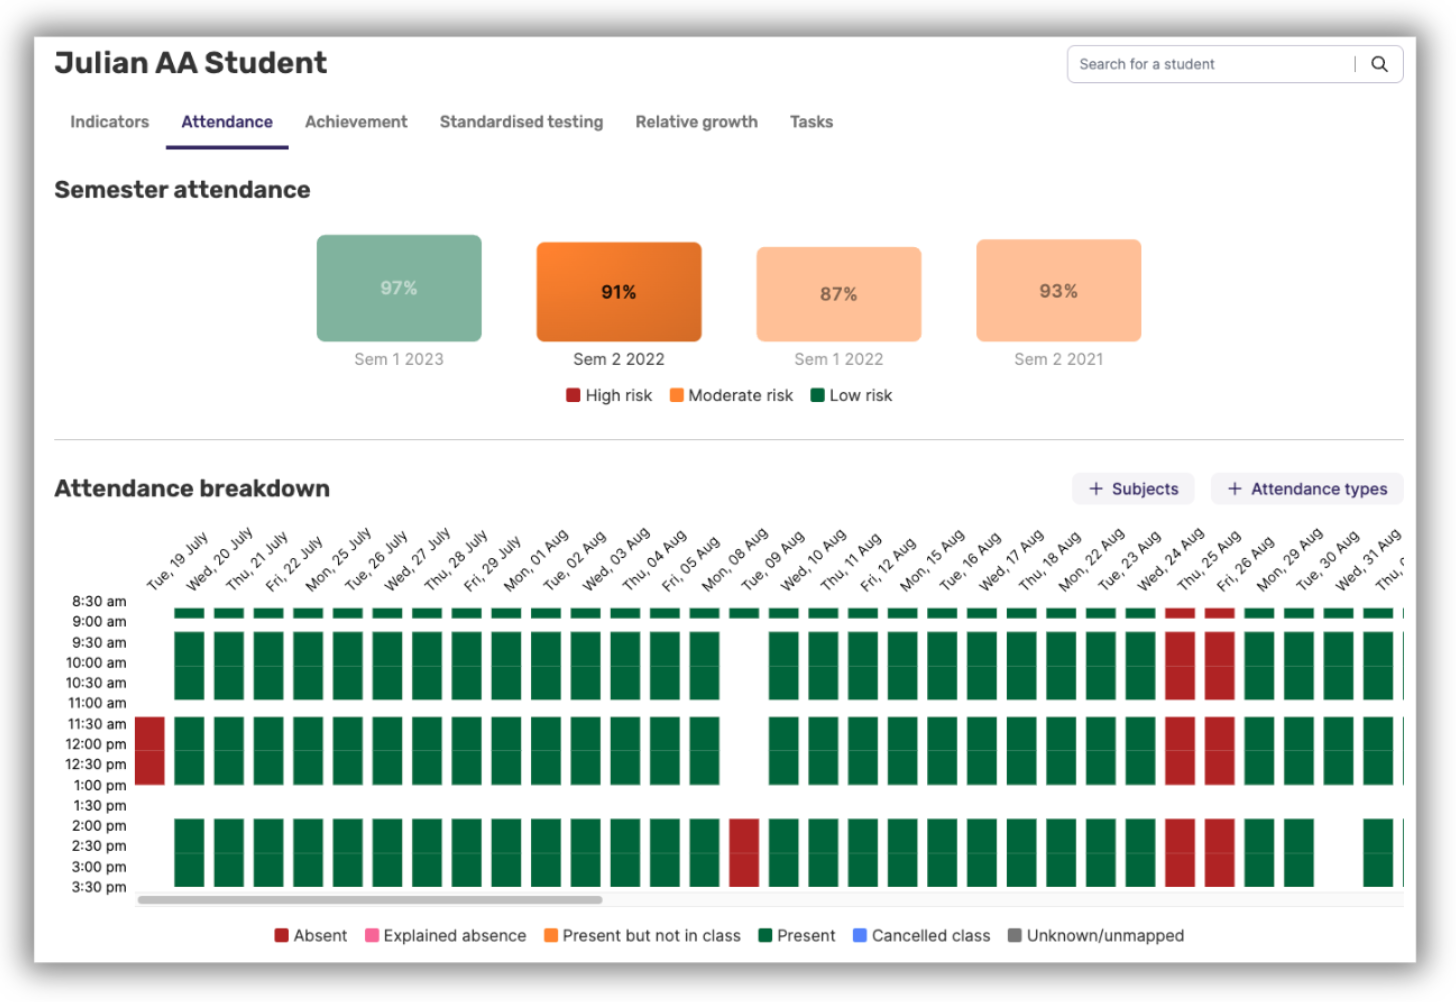
Schools have a choice of having average semester attendance being calculated based on either 'Minutes absent from school', or 'Minutes absent from class'. You'll find further information about which attendance codes are included in these calculations through this article here.
➡️ Achievement semester rollup
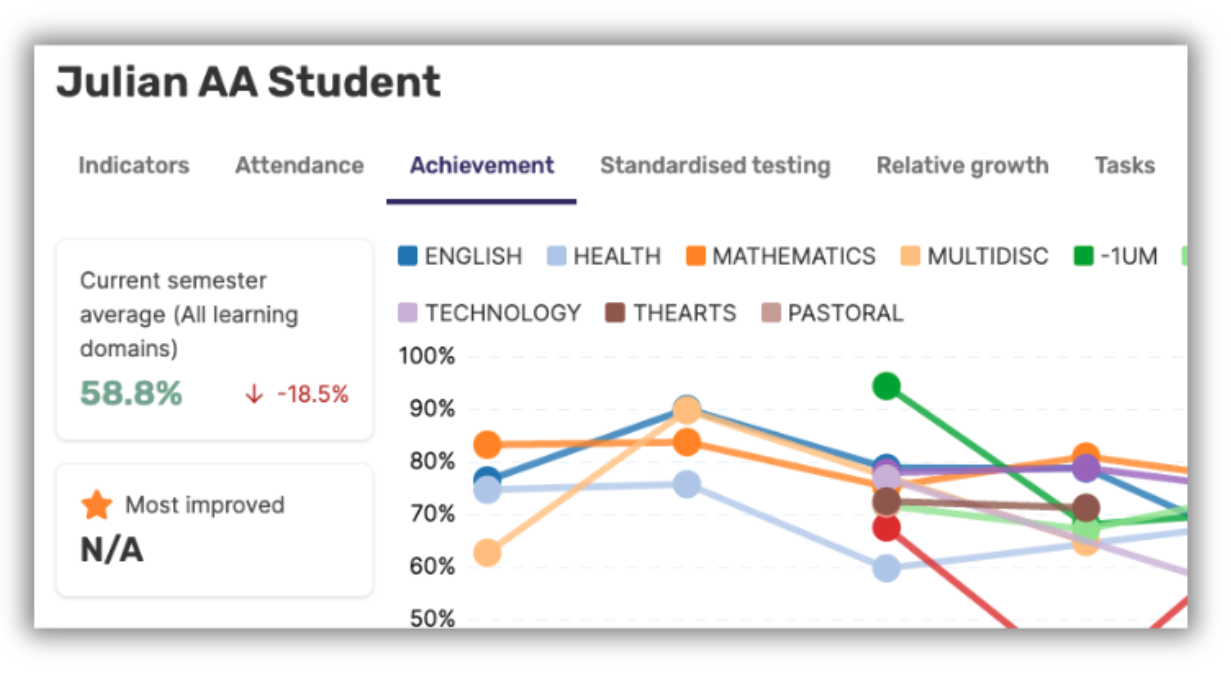
There is a two-step process involved in presenting this overall achievement result:
- In Admin → Customisation → Achievement, users with administrative privileges can exclude assessment categories pulled from the source data for achievement (or which can be defined in Data Management → Source Code Mapping)
- Achievement categories not selected for inclusion will not contribute to a student’s achievement % for a class, which in turn, will affect the overall achievement percentage for a semester.
➡️ Assessment weightings
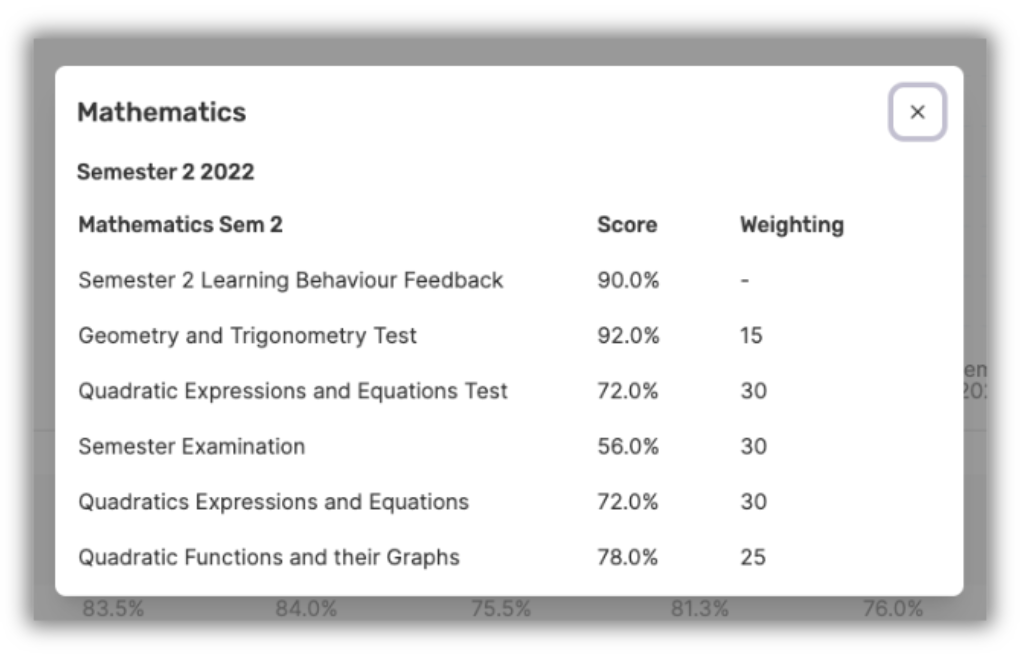
It is fairly common classroom practice to weight assessments differently, i.e. Assessment 1 may be worth 30%, Assessment 2 worth 30%, and Assessment 3 worth 40%. Calculating a semester total where class-based assessment weightings are concerned works as follows:
- If one assessment in a class is weighted, all assessments must be weighted, otherwise, our calculations will ignore the assessments with no weightings. This is because we can't calculate the weighted value of assessments with no allocated weighting where a teacher has indicated that weightings are being used (in that there is one assessment with a weighting).
- If there are no weightings, the results are averaged.
- It does not matter if the weightings do not equal 100 - we can account for this.
- With weighted assessments, we take the performance percentage for the first assessment, treating it as “all” of the “whole”. When the second is submitted, we re-calculate what the “whole” is based on the second assessment’s weighted value and re-calculate the performance percentage for each, then sum them. We continue this process for each subsequent assessment.
➡️ Cohort Average
In the Indicators tab of a Learner, Cohort Average helps provide context for a student's performance by comparing their results to their peers in the same semester. To calculate the cohort average for the student, for the semester, we identify the classes in which the student is enrolled and then determine the average results for these classes across all other students in the same semester.
For example, if a student in Semester 1, 2025 is enrolled in ENG-A, MATH-A, and SCI-A, the cohort average will be calculated as follows:
Cohort Average for Semester 1, 2025 = The average of:
- The average result for all other students enrolled in ENG-A in Semester 1, 2025.
- The average result for all other students enrolled in MATH-A in Semester 1, 2025.
- The average result for all other students enrolled in SCI-A in Semester 1, 2025.

➡️ 'Like student'
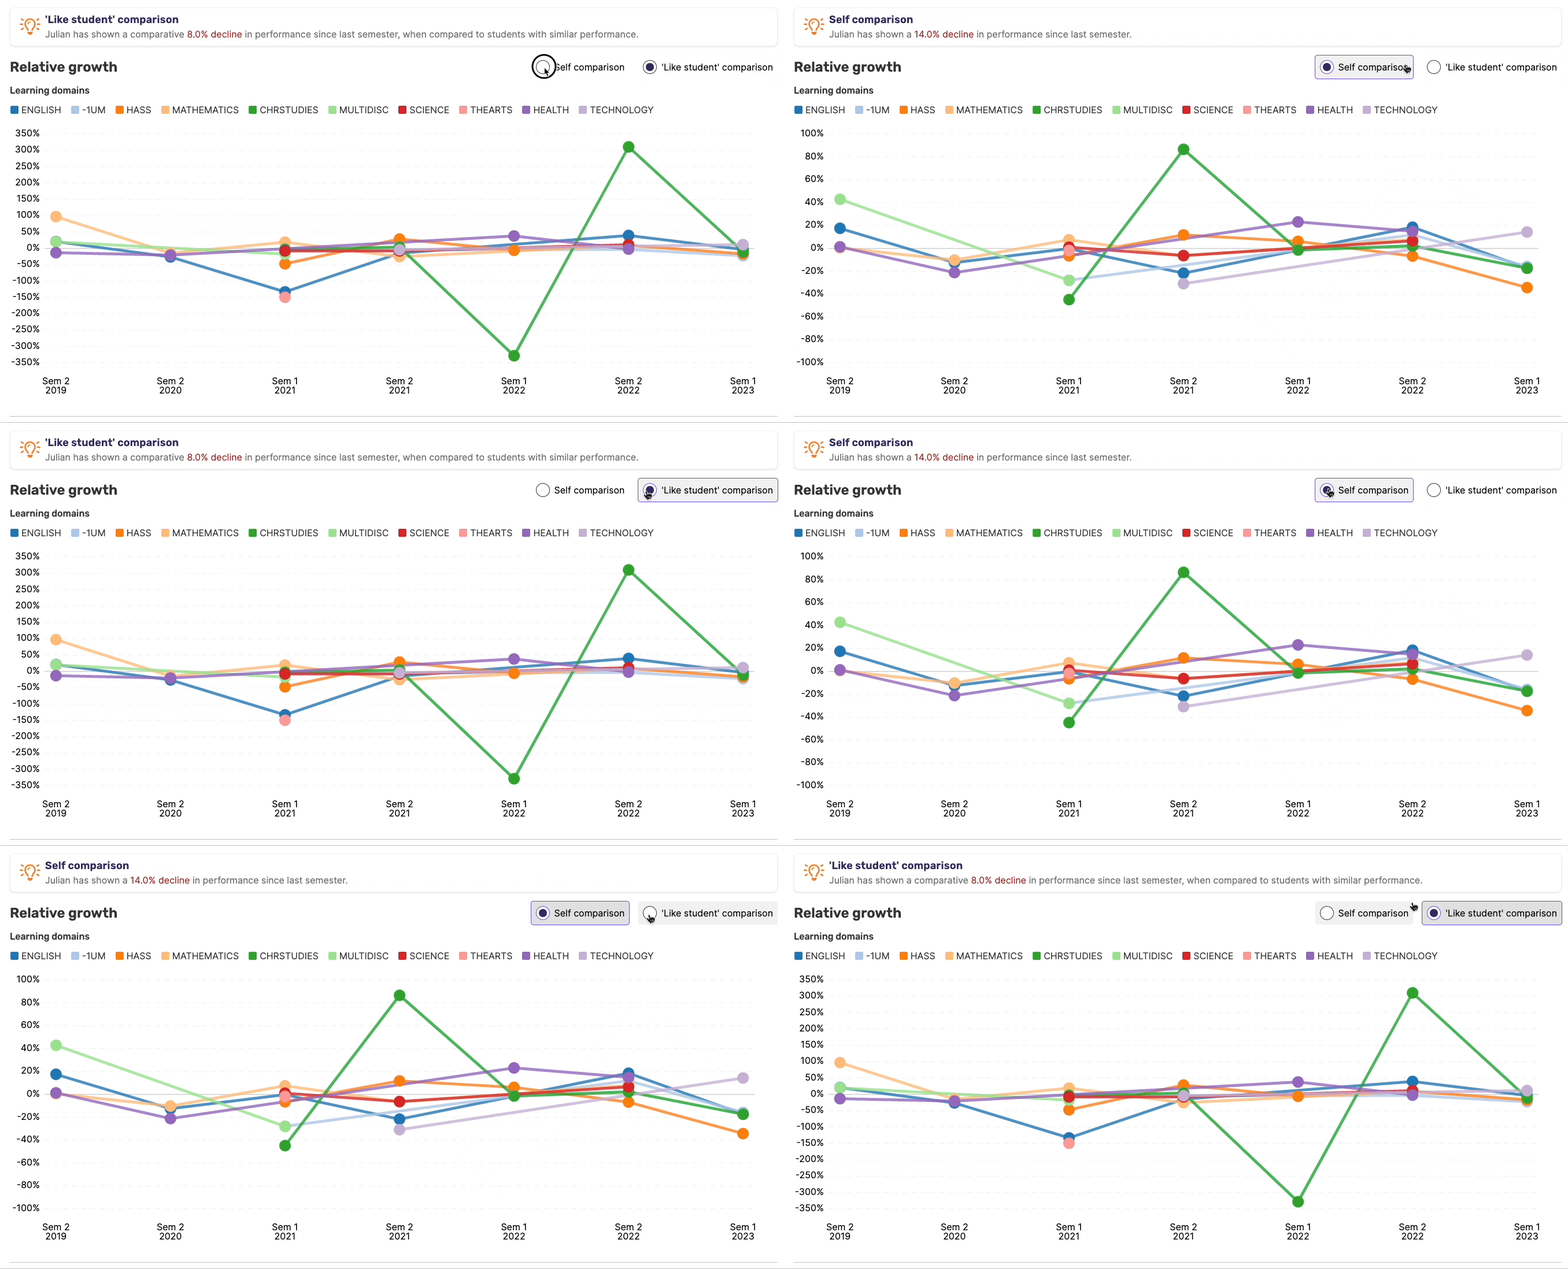
'Like students' are referred to in the Relative growth tab of the Learner Profile, where comparisons can be made between an individual student's growth and the growth rates of others within their cohort considered to have similar performance, a.k.a. 'like students'.
- By default, 'Like students' are defined as those within a 10% range of the student.
- If there are no students within the 10% range, the range is expanded to include those students who fall within 5% on either side of the student's result.
- If there are more than 10 students within the 10% range, the range will decrease to 5% to provide a more accurate comparison.
➡️ ZPD (Zone of Proximal Development)
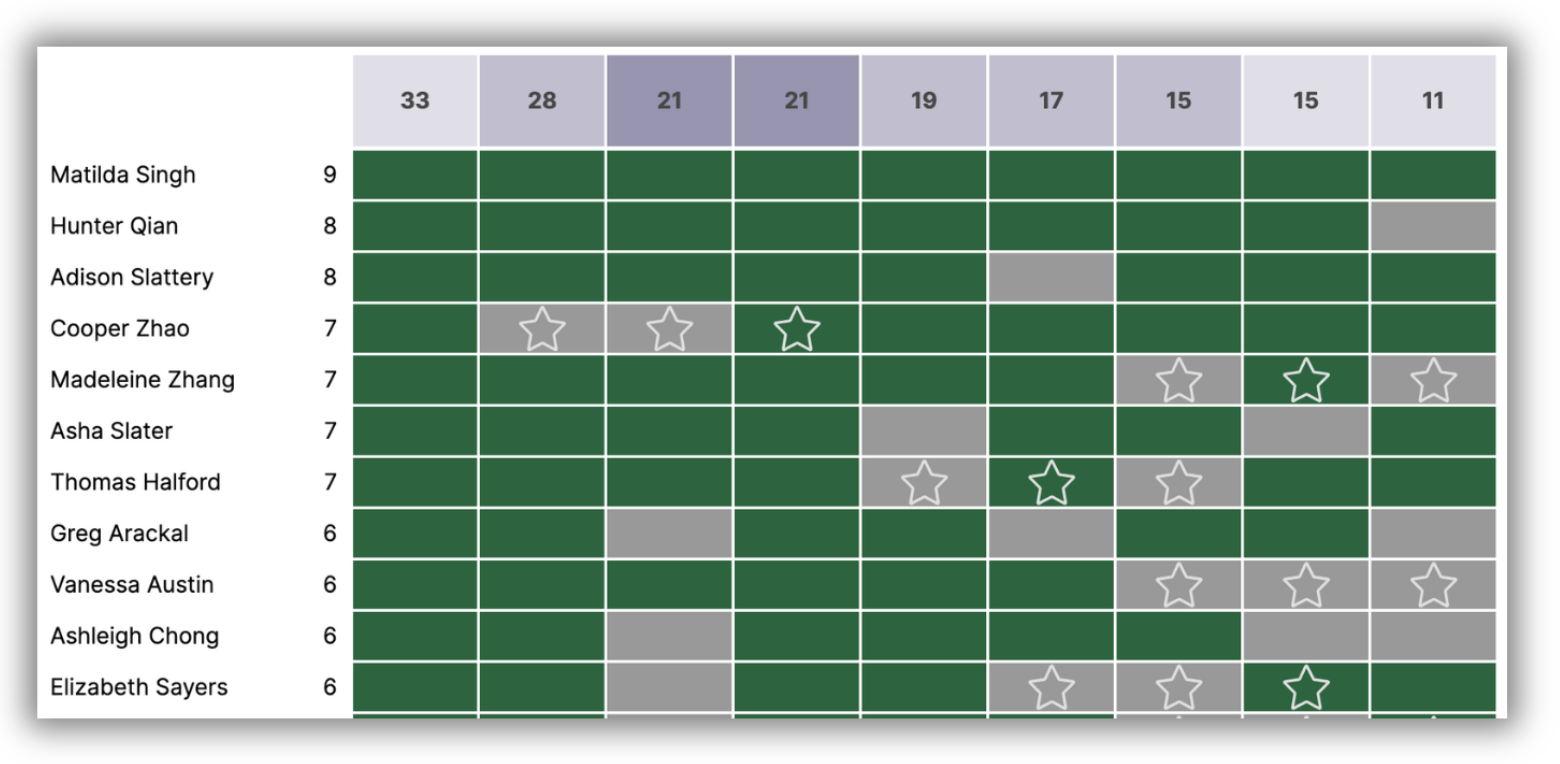
At a high level, we use a sliding window. The window's size (i.e. number of questions in the window) is proportional to the number of questions in the question bank.
Inside this sliding window, we check how many questions the student answered incorrectly or skipped, and if it exceeds the threshold, we mark the start of that window as the start of the ZPD. Currently, the max window size is 5, and the max threshold size is 3. So for most tests, the first instance the student gets 3/5 incorrect is the ZPD.
➡️ Growth rates
We've written an entire article dedicated to Growth rates - take a look here.
➡️ Cohort Relative Growth
To understand how we calculate Cohort relative growth including Percentile rank and performance, take a look at this article here.
🤔 Need further support?
We're ready to help anytime. Reach out at help@intellischool.co.