➡️ See what your colleagues have made
As long as you’re not the very first user of Creator for your institution, the easiest way to start exploring your data is by looking at dashboards, charts, and lists that your colleagues have already created. The best place to start is by checking out any dashboards that might be pinned on your home page, or in collections you have access to.
➡️ Browse your data
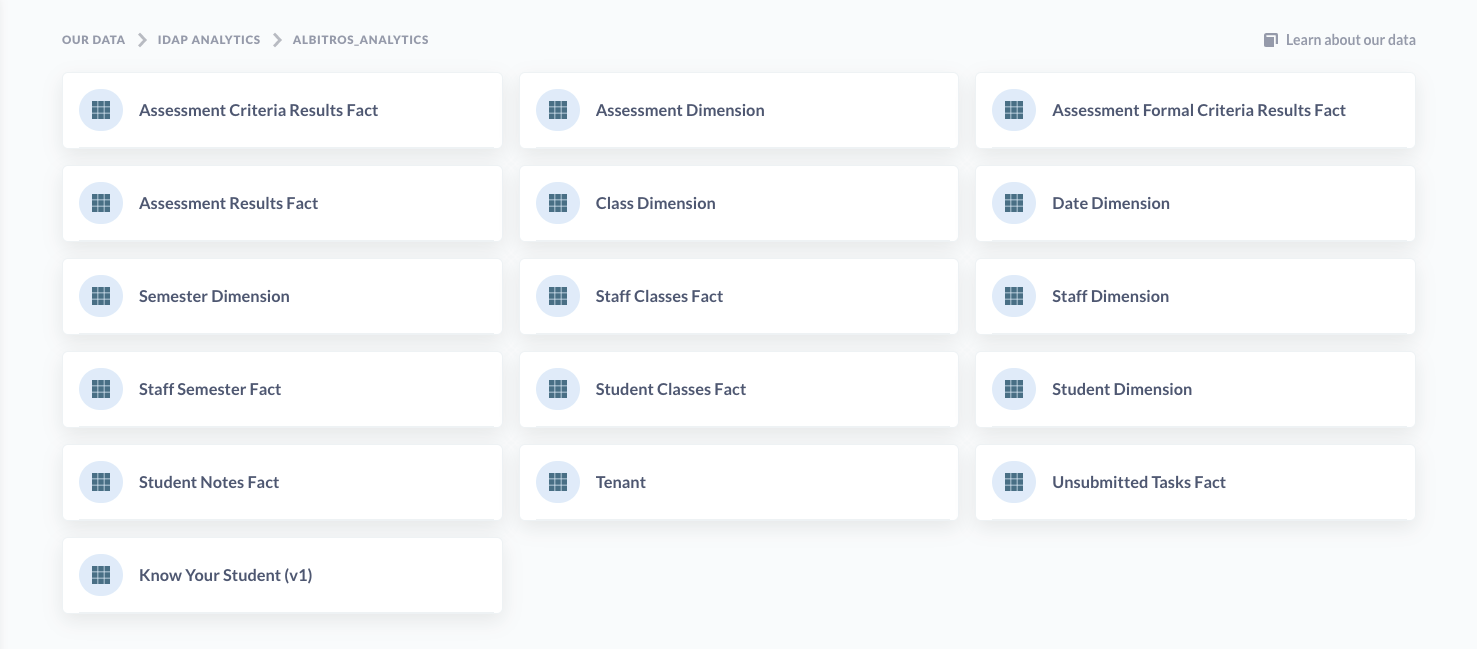
Alternatively, you can dive right into exploring the data in the Intellischool Data Platform (IDaP) by clicking on the Data browser button in the navigation bar, and then selecting the IDaP Analytics database, selecting a schema, and clicking on a table to view its data. You can also click on the bolt icon on any table to see an automatic exploration of its data. Give it a try!
➡️ Exploring collections
Collections in Creator are a lot like folders. They’re where all your school's dashboards and charts are kept. To explore a collection, just click on one in the Our analytics section of the Creator home page, or click on Browse all items to see everything.
If your colleagues are cool, they’ll have pinned some important dashboards or questions within your collections; if so, those important or useful items will show up in a different colour at the top of a collection.
Collections have a list of any other items that are saved within them, and you can see what other collections are saved inside of the current one by checking out the navigation sidebar.
➡️ Exploring dashboards
Dashboards are a set of questions and text cards that you want to be able to refer back to regularly. Learn more about dashboards.
If you click on a part of a chart, such as a bar in a bar chart, or a dot on a line chart, you’ll see the Action menu, with actions you can take to dive deeper into that result, branch off from it in a different direction, or create an X-ray to see an automatic exploration of the data.

Clicking on a table cell will often allow you to filter the results using a comparison operator, like =, >, or <. For example, you can click on a table cell, and select the less than operator < to filter for values that are less than the selected value.

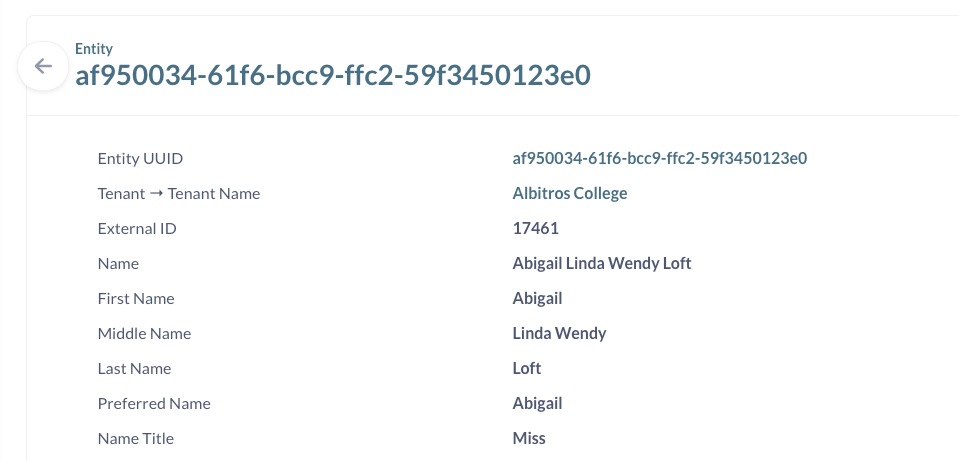
Lastly, clicking on the ID of an item in a table gives you the option to go to a detail view for that single record. For example, you can click on a student's entity ID to see the entity record for that student.
When you add questions to a dashboard, you can have even more control over what happens when people click on your chart. In addition to the default action menu, you can add a custom destination or update a filter. Check out interactive dashboards to learn more.
➡️ Exploring saved questions
In Creator parlance, every chart on a dashboard is called a “question.” Clicking on the title of a question on a dashboard will take you to a detail view of that question. You’ll also end up at this detail view if you use one of the actions mentioned above.
When you’re looking at the detail view of a question, you can use all the same actions mentioned above. You can also click on the headings of tables to see more options, like summing the values of a column, or filtering based on that column.
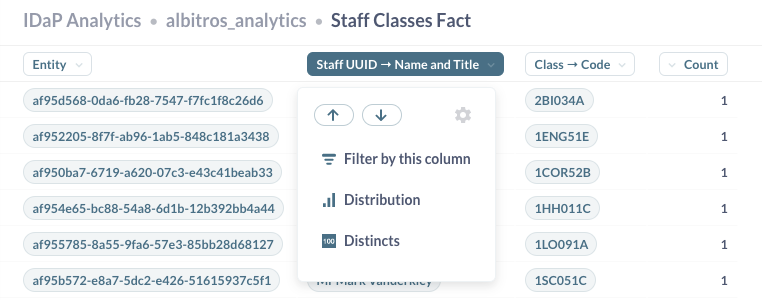
One of our personal favourite ways to explore is with the Distribution option. This will show you how many rows there are in a given table, grouped by the column you clicked on. So if you have a set of students, if you click on an Age column and select Distribution, you’ll see a bar chart with the count of students you have in each age bracket.
🤔 Need further support?
We're ready to help anytime. Reach out at help@intellischool.co.