
You're new to Intellischool Analytics and you'd like to start with a walkthrough for yourself, or for your team.
You've now got access to great data all in one place, but you know it's going to be a lot to take in, so where to start? Here's a couple of ideas for you to explore.
🌿 Examining student growth
📈 Aptitude and learning area performance
📚 Literacy and numeracy
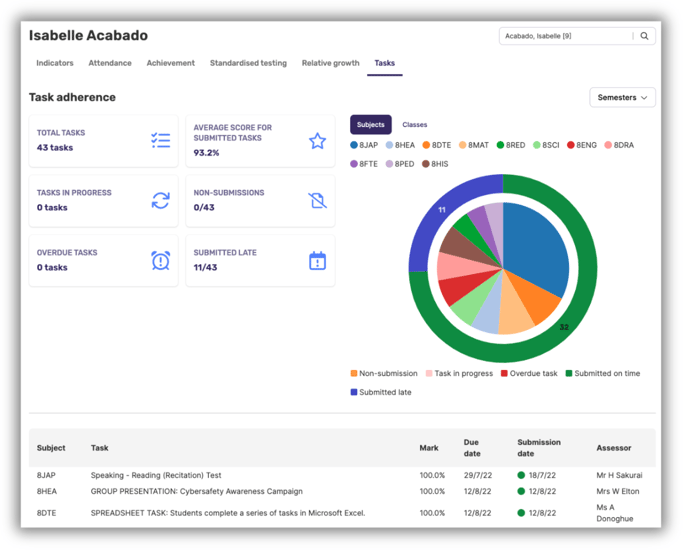
⏰ Time and task management
📺 Dashboard walkthrough videos
🔗 Dashboard Help Centre article links
🌿 Examining student growth
The Relative growth tab in the Learners lens is a great place to start when getting to know your classes through data. This report gives teachers an excellent opportunity to drill-down into student growth by:
- Determining the general aptitude of an incoming year level or your new classes by examining their levels of literacy and numeracy.
- Getting a sense of the performance of your new students in your Learning Area.
🤔 Questions to consider when viewing this tab:
- In which subject(s) has the student shown the strongest growth?
- In which subject(s) has the student stalled in their academic growth, or regressed?
- Are there any outliers to be investigated? e.g. Subjects where there has been unexpectedly steep growth or decline
📈 Aptitude and learning area performance
Intellischool Analytics can provide some excellent information on your classes' strengths and challenges in your learning area.
In the Cohorts lens, click on the Achievement tab, select the semesters and learning area you'd like to examine. This is a great report for determining the ways in which you may need to differentiate for capability and to see whether students have shown growth or regression in your learning area.
🤔 Questions to consider when viewing this tab:
- Which 'bands' are the widest (i.e. represent the largest number of students), and which are the narrowest? Is this distribution what we'd expect to see for the given cohort, subject(s) and time period?
- Has there been a significant shift in distribution of students across bands within the chosen time period? What could be the reason(s) for this?
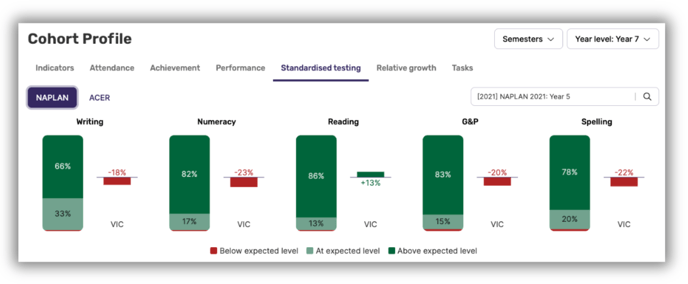
📚 Literacy and numeracy
Starting with NAPLAN and then moving onto ACER or Allwell (depending on which external tests your school uses), the Standardised testing tab in the Cohort profile can be a great support to teachers in better understanding the levels of literacy and numeracy for students as shown throughout external testing results.
Where comparative test results are present, this report will show you growth rates for the given cohort in comparison with statewide results, which can be a great jumping-off point for discussion in learning area meetings.
🤔 Questions to consider when viewing this tab:
- How does the cohort's rate of growth against each domain within literacy and numeracy compare to the state's rate of growth?
- What proportion of students sit below, at, and above expected levels? Is this what we'd expect to see from this cohort? What could be the reason(s) behind this distribution?
- Where are the biggest opportunities for improvement for the given cohort? Do we cover the skills identified as being the 'top areas for improvement' rigorously enough in our current scope and sequence?
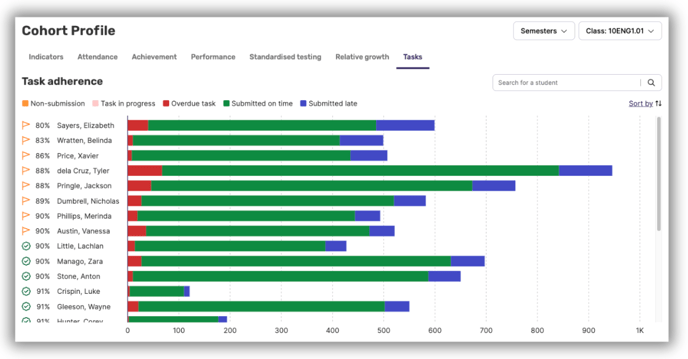
⏰ Time and task management
Whether you're keeping on eye on workload for a year level, you're a homeroom teacher or you want an easy way to track all assessment and task submissions for your class, the Tasks tab in both the Learner and Cohort lenses is the place to be.
You can use Tasks to track assessment submission status for classes or larger groups such as houses or whole year levels. Or, if you're getting to know a class, you might like to look at their submission practices in your learning area for the year prior to get a feel for their work habits.
🤔 Questions to consider when viewing this tab:
- How well do my students deal with assessment deadlines?
- Which students have the greater proportion of tasks submitted late, or overdue?
- Are there particular subjects where students are submitting work late more than others?
📺 Dashboard walkthrough videos
Take a look at the below walkthrough videos for our Progress and Performance dashboards. You'll find bookmark links in the description for each video so you can skip ahead to the explanation for each individual tab.
🌱 Progress walkthrough video
🌿 Performance walkthrough video
🤔 Need further support?
We're ready to help anytime. Reach out at help@intellischool.co.
💡👩🏫 We'd love to help you and your team with bespoke training for your school - click here to get in touch and find out more.