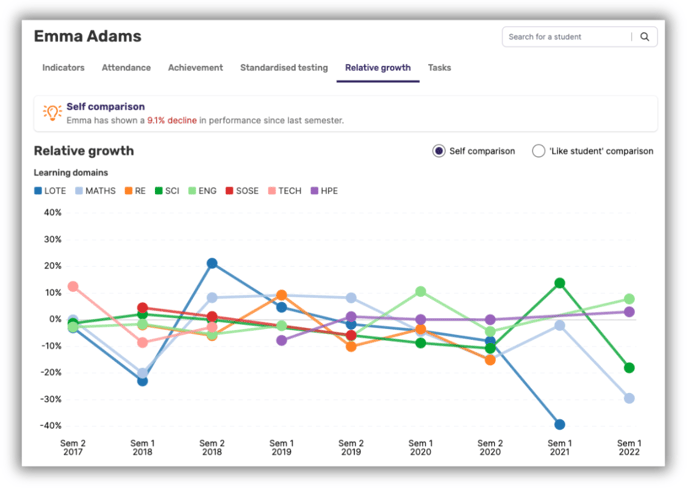
How are growth rates calculated?
Depending on the type and breadth of data available, Intellischool Analytics uses a number of mechanisms to calculate a student's rate of growth.
Measuring growth is a critical functionality within Intellischool Analytics. In order to calculate growth for an individual student, Analytics requires:
- Two distinct results for a student;
- The results to be dated at least two weeks apart;
- The results to be of the exact same type - for example, two school-based assessments in the same learning domain, or two standardised testing results from the same provider and on the same testing scale; and
- Ideally, the results should be using the same grading scale, and failing that, the results must be able to be converted to a like scale for comparison.
Core concept: A growth score of zero indicates that a student is growing at exactly the same rate as the selected benchmark comparison, whether that benchmark is their own prior performance, or that of a like-student.
➡️ Growth on non-standardised assessments
Intellischool Analytics converts numeric (e.g. 5/6 or 76/100) and descriptive (A+, good, satisfactory) scales to percentage scores prior to any growth calculations. Numeric scores are converted automatically. Descriptive scales are converted using the configuration in your LMS or grading tool.
Note: Growth calculations for numeric and descriptive scales assume that difficulty in assessments on the same topic increases proportionately with time unless an assessment is grouped in a pre/post testing set.
To account for the difference in difficulty between assessments, Intellischool Analytics calculates a benchmark based on the median result from the cohort of students that completed the assessment.
The growth benchmark is calculated as follows:

Where Gc is the benchmark growth rate, μ2 is the median result for the cohort from the most recent assessment, and μ1 is the median result for the cohort from the previous assessment.
Then, the same calculation is applied to the individual student's results:

Where Gs is the student's growth rate, R2 is the student's result from the most recent assessment, and R1 is the student's result from the previous assessment.
Finally, the student's individual growth rate is calculated based on the difference between their result and the cohort median growth as follows:

Where Gs and Gc have the same meanings as previous, and Ga represents the actual growth figure for the student.
➡️ Growth on pre- and post-testing sets
Calculating growth between pre- and post-tests (and optionally mid-unit tests) assumes that the test given to each student has the same level of difficulty. Initially, growth between these types of assessments is a simple calculation:

Where G is the growth rate, R2 is the most recent test result, and R1 is the previous test result.
➡️ Growth on standardised assessments and progressive scales
To calculate growth on a standardised assessment (such as results from NAPLAN, ACER PAT, ICAS, AAS, etc.), or on a progressive scale (such as the Victorian Curriculum continuum, or the Fountas & Pinnell Text Level Gradient™️), Albitros needs to know some key information:
- The age of the student at the time they completed the assessment; and
- The age-expected result (or range of results) for each student age group.
The age-expectation is usually set by the standardised testing provider, or by the progressive scale author. Standardised testing age-expected levels are set automatically by Intellischool Analytics, but school-developed progressive scales can be configured in consultation with Intellischool.
Assuming the required information is available, Intellischool Analytics then uses difference between age-expected levels on the two results to calculate the student's growth above or below the age-expected growth level.
Remember: A growth score of zero on a progressive scale indicates a student is growing at exactly the age-expected level of growth. In our visualisations, this is commonly represented as a trend line moving upward at around 40°.
🤔 Need further support?
We're ready to help anytime. Reach out at help@intellischool.co.
