
Letter- or category-based scales are often used in assessment as an alternative to numeric scores.
Whilst Intellischool Analytics can interpret these scales without any additional configuration, often it is worth spending some time understanding how non-numeric scales are applied in calculations.
➡️ Converting non-numeric results
In order for a computer system to be able to interpret a non-numeric result and plot it on an X and Y chart axis, the result must first be converted into a number. By default, Intellischool Analytics will consider a result to be unweighted, unless the data has an accompanying weight.
It is highly recommended that schools apply weights to non-numeric scales for the best experience when using Intellischool Analytics.
➡️ Unweighted conversion
Take the following simple category-based scale as an example: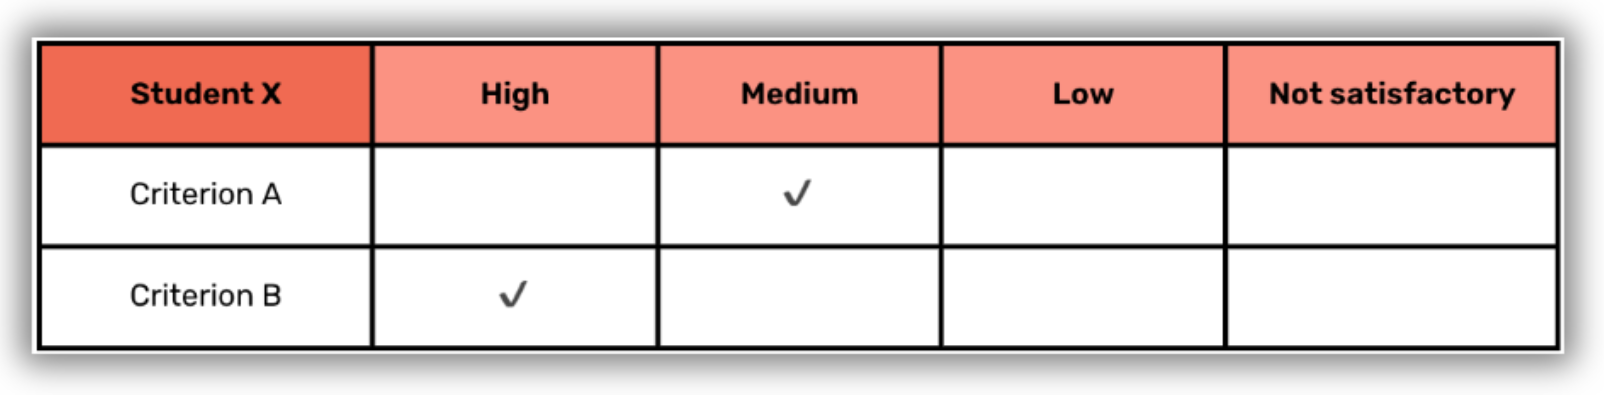
Intellischool Analytics will interpret these results such that the:
- Maximum score is 4 (being High);
- Minimum score is 1 (being Not satisfactory).
Because Student X received a result of Medium for Criterion A, they are considered to have received a score of 75% (i.e. - 3 out of 4).
When calculating Student X's total score, they are considered to have received a score of 87.5% (i.e. 3 out of 4 for Criterion A, and 4 out of 4 for Criterion B).
This practice might work well for simple, smaller scales, but for schools / institutions with larger scales, scores can be weighted incorrectly and skew outcomes in visualisations.
➡️ Weighted conversion
Weighted conversions apply different weights to the various possible scale results. Take the following scale as an example: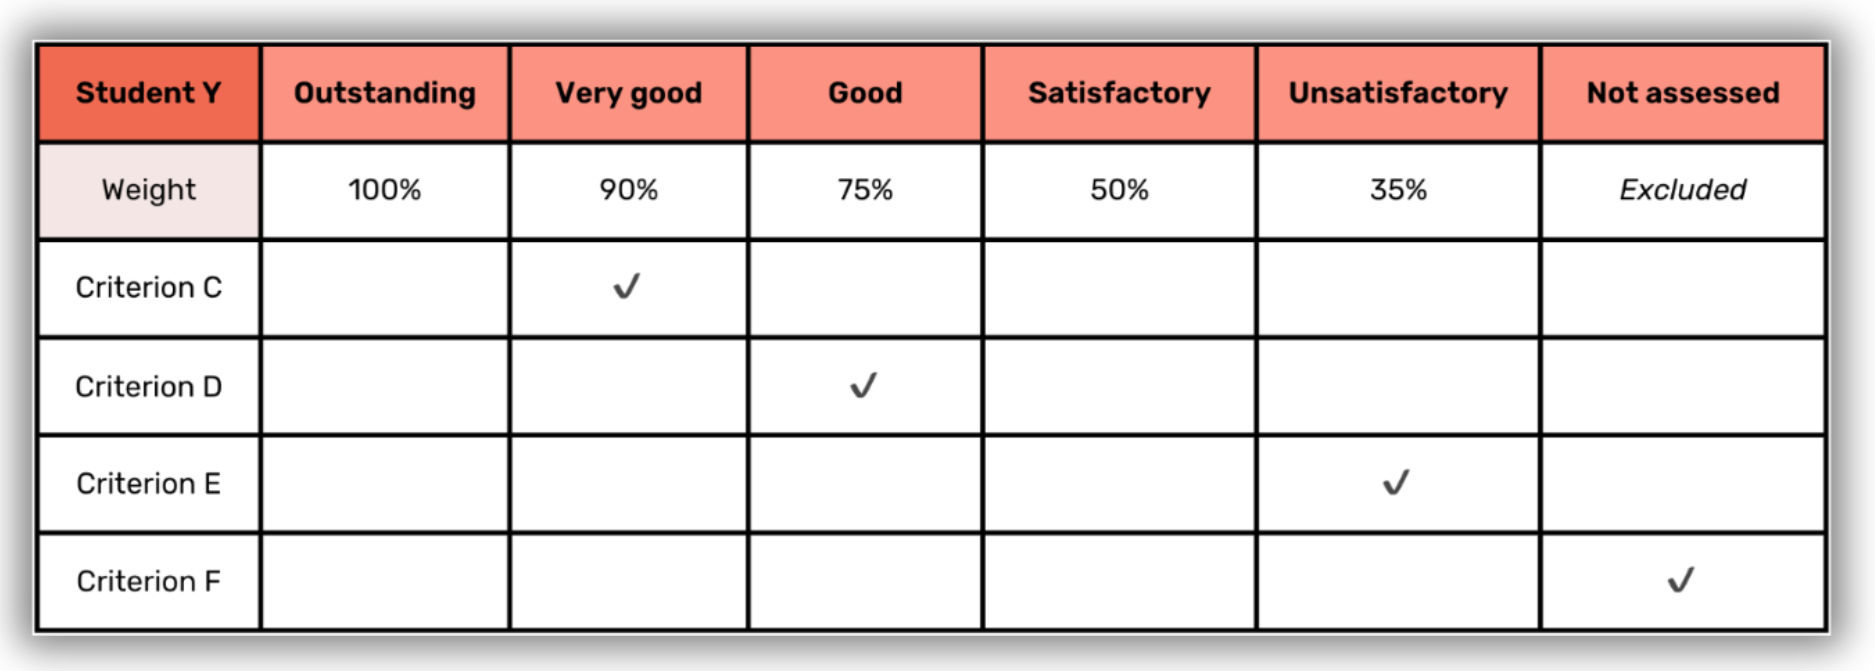 Intellischool Analytics will interpret the various scores according to their weight. Notice that:
- Unsatisfactory is weighted at 35%; and
- Not assessed is excluded.
As a result, Intellischool Analytics will never assign a student a score of less than 35% for any one criterion, and any criteria marked as Not assessed will be excluded from calculations.
When calculating Student Y's total score, they are considered to have received a score of 66.66% (i.e. the average of 90% for Criterion C, 75% for Criterion D and 35% for Criterion E). Because Criterion F was marked in a column that is excluded from results, it has been excluded from the calculation.
🤔 Need further support?
We're ready to help anytime. Reach out at help@intellischool.co.